Does a cable change the sound? We measured it
Our Purity CHP-12B cable, 1.2 m, one multi-driver earphone, ten frequencies. It costs 0.27 dB of level and shifts the balance by at most 0.14 dB.
The question, plainly: if you put an upgrade cable on your earphones, does the sound change? We measured our own cable to answer it — a Purity CHP-12B, our four-core upgrade cable. Here is what we found, in ordinary language, with the numbers next to it.
The short answer
A cable does two things to the signal on its way to your ear. It takes a little of it, and it takes slightly more of some frequencies than of others. Both effects are small on this cable — small enough that the second one is below what listeners can pick out.
- Loudness. With the cable in line, about 0.27 dB less reaches the earphone at 1 kHz. That is a volume setting, not a change of tone: turn the dial up a hair and it is gone.
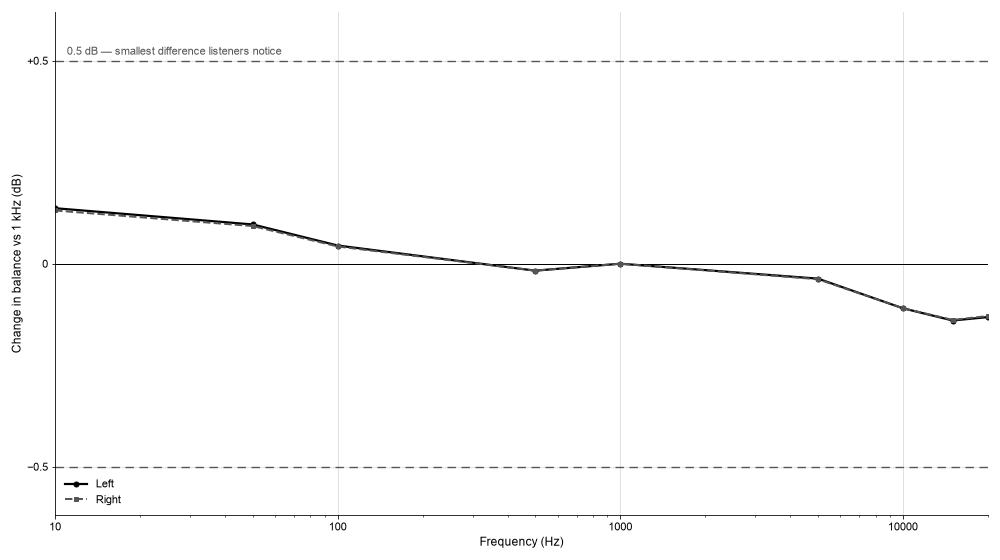
- Balance. Across the band, the biggest shift we found was +0.14 dB at 10 Hz and −0.14 dB at 15 kHz. The whole curve lives inside 0.28 dB from top to bottom.
- The part that matters most is the flattest. In 2–8 kHz, where the ear is most sensitive, the shift stays under 0.04 dB.
- Left against right. The two channels of the same cable differ by 7.1 mΩ, which works out to about 0.008 dB between the ears. Nothing.
- For scale: in listening tests with a pure tone and nothing else playing, people can just notice a difference of about 0.5 dB. Our worst number is under a third of that, and our best is about a fifteenth of it.
The four numbers underneath are the same answer in short form, and the chart a little further down is the answer in one picture: what the cable does to the balance, against the line where it would start being noticeable.
- Largest change in balance
- 0.14dB
- Level lost at 1 kHz
- 0.27dB
- Left against right
- 0.0077dB
- What listeners notice
- 0.5dB
How we measured, without the lab words
One cable, and it is ours: a Purity CHP-12B — 1.2 m, four cores, 2-pin 0.78 mm flat at the earphone end, 4.4 mm balanced (5-pole) at the source end — measured against one earphone we use as a reference in the lab, a multi-driver in-ear. We do not print the earphone’s name on this page: we publish our own measurements, not comparisons with other companies’ products.
We read the electrical behaviour at ten frequencies from 10 Hz to 20 kHz, on four things: each core on its own, each side of the cable as a complete loop, and the earphone with the cable attached, left and right separately. The instrument, the method and the conditions are on the testing page.
Two things about where these numbers came from, because they change how far you can trust them:
- This is one pre-production sample, not a unit off the production line. The measurement day was 4 November 2026.
- An earlier round, in October 2026, had one point set to 15 Hz by mistake when it should have been 15 kHz. We found it, and nothing from that round is on this page. Everything here is from the corrected round.
Why a cable can only do a little
The cable and the earphone share the signal between them. Think of it as two loads in series, splitting the same electrical pressure: the bigger share goes to whichever has the higher opposition.
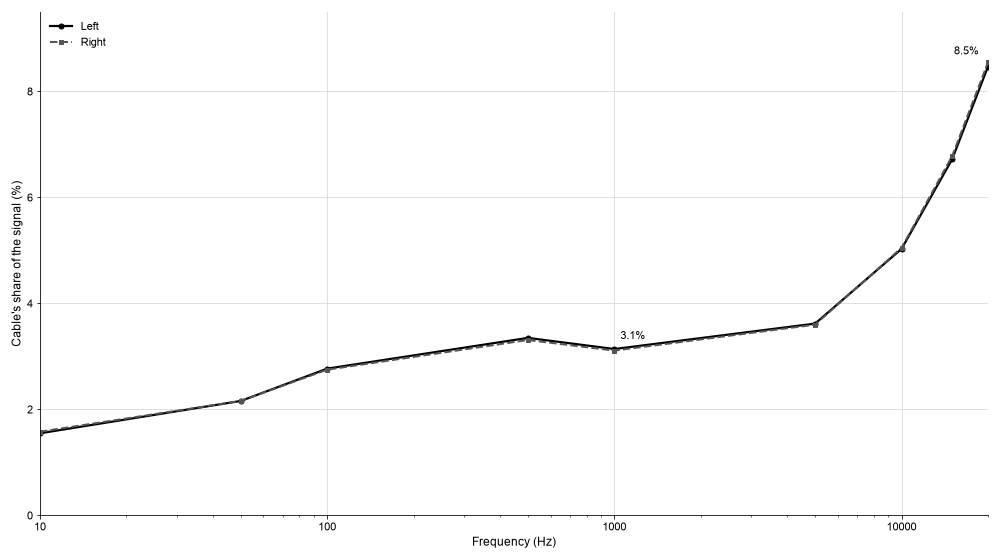
In the middle of the band, the cable’s own opposition is about 0.24 Ω. The earphone’s is much larger, and it moves a lot with frequency: about 15.8 Ω at 10 Hz, 7.7 Ω at 1 kHz, 5.2 Ω at 20 kHz. So the cable takes roughly 1.6% at the bottom, 3% in the middle and 8.5% at the top. Almost everything in the rest of this page is the shape that difference makes.
A loop of wire also resists fast changes a little more than slow ones — it behaves as a very small choke. By 20 kHz the cable’s opposition has grown from 0.24 Ω to about 0.44 Ω. That growth, plus the earphone’s own opposition falling at the same time, is where the top-end loss comes from.
None of this is a claim that the cable is “transparent” or “neutral”. It is arithmetic about how much of a small quantity a passive cable can take.
How much of the signal the cable takes
This is the least mysterious part of the measurement and the reason everything else is small. The cable’s share of the signal stays near 3% through the middle of the band — the part where music has most of its content — and only creeps up at the very top, where the earphone itself has become easy to drive.
Two numbers to hold onto from this chart: 3.1% at 1 kHz, and 8.5% at 20 kHz. A cable that takes 3% of the signal cannot repaint the sound; it can only trim the edges slightly.
What the cable does to the balance
The absolute level drop is not the interesting part — it is nearly the same at every frequency, and the volume dial pays for it. The interesting part is what the cable does differently at different frequencies, because that is what would change the tone.
Reading the chart:
- The curve is pinned near zero. Highest point +0.14 dB at 10 Hz, lowest −0.14 dB at 15 kHz, and it crosses the flat, dead-centre region between 200 Hz and 5 kHz where music lives.
- The low end lifts rather than losing. Nothing is added to the signal: at 10 Hz the earphone’s opposition climbs to about 15.8 Ω, so the cable’s share drops to 1.6% and the loss simply gets smaller. Measured against 1 kHz, a smaller loss looks like a lift.
- The top end loses a little, because at 15–20 kHz the earphone is down to about 5.2 Ω while the cable has grown to 0.36–0.44 Ω.
- Be clear about the cause. That top-end tilt is mostly this earphone’s impedance falling with frequency, not the cable acting on its own. Swap in a plain 4–30 Ω load and the cable’s own extra tilt at 20 kHz is under 0.03 dB.
- The timing side is equally small: phase stays under 0.31° up to 5 kHz and reaches 3.9° at 20 kHz. Converted to a delay, that is about 188 billionths of a second against roughly 10 thousand-millionths of a second for the ear to notice a timing difference between the two ears.
Band by band
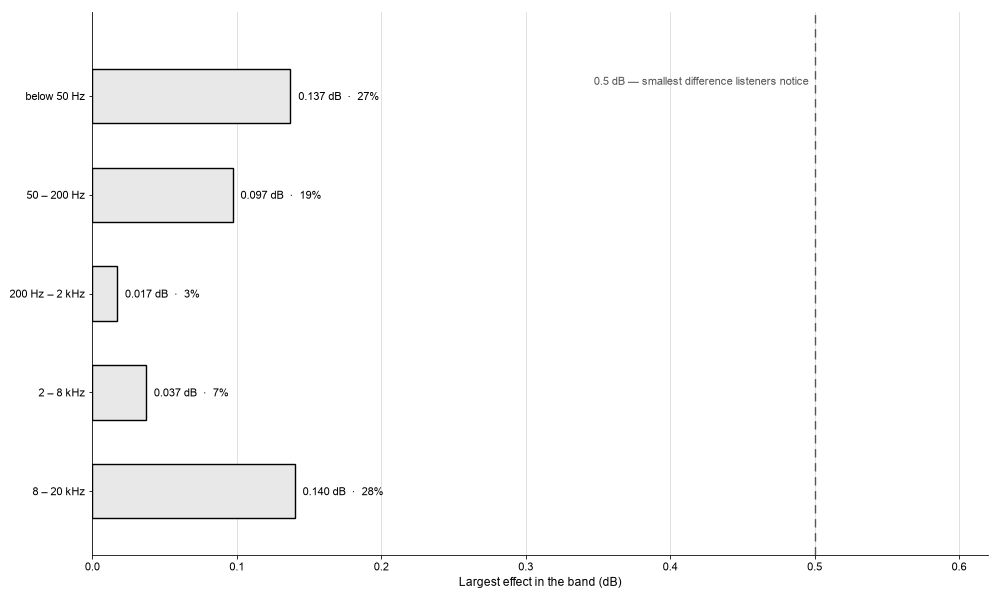
The same result cut into bands, which is easier to judge than a curve:
No band comes anywhere near the line. The band the ear cares most about, 2–8 kHz, is at 7% of it.
We also measured 20–40 kHz in the report, and left it off this page: most adults cannot hear up there, and one point in that range was not internally consistent (see What these numbers do not cover).
Left and right
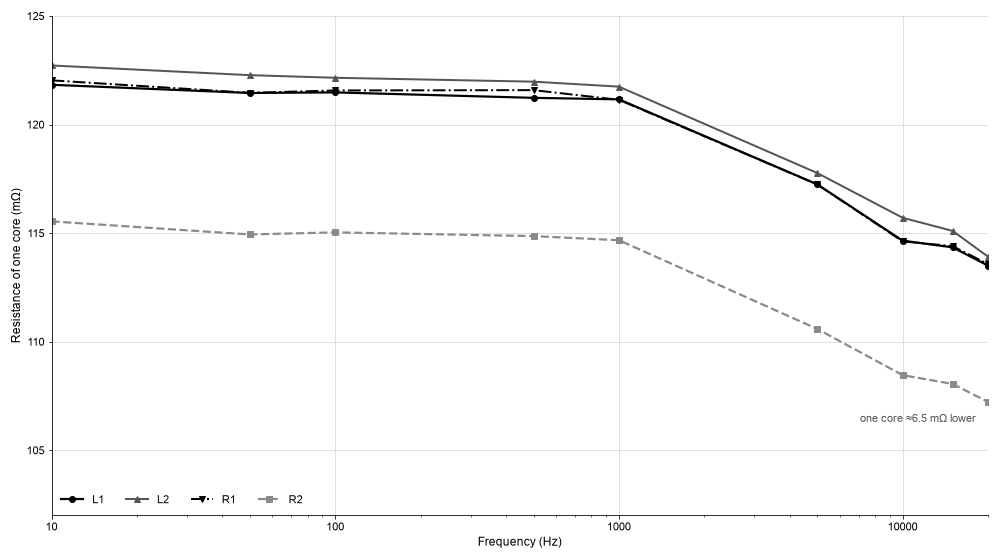
We measured the four cores one at a time, and one of them does not behave like the others.
Three cores sit around 121 mΩ at 1 kHz; the fourth sits about 6.5 mΩ lower. That single core is the whole reason the two channels differ by 7.1 mΩ — and 7.1 mΩ in this pairing is about 0.008 dB between the ears, roughly one and a half percent of what a listener can notice. The difference between the two channels is the same at every frequency we measured, which means it is a fixed manufacturing difference, not noise in the reading.
So this is not an audible problem. It is a factory-consistency problem, and ours to fix: a 6.5 mΩ gap is about the same as 8 cm of missing copper, so the fix is holding the cut length to task and checking that core’s joints.
One honest note here, because it is easy to overclaim: there is no standard that says how close the two sides of a cable have to be, and we are not going to invent one and call it a specification. What we can defend is the arithmetic — our own sample’s channel difference comes out at 0.008 dB, against about 0.5 dB that people can just hear.
How this lines up with our specification
The specification page states 80 mΩ per metre, per core, and labels it as a value that comes from the conductor build rather than from a finished cable. On this sample, a finished core measured about 121 mΩ for its 1.2 m, connectors included. Allow 25 mΩ for the connectors and contacts — that allowance is our own estimate, not a separate measurement — and the copper comes out at 80.1, 80.6 and 80.1 mΩ/m on three cores, and 74.7 mΩ/m on the fourth.
So the published figure holds for three cores out of four. It is still labelled conductor-derived on the specification page, because what we have measured is a pre-production sample, and that is not the same claim as measuring the product we ship.
What these numbers do not cover
- One cable, one reading per point. We have not measured a batch, so we cannot tell you how two cables differ from each other. That spread is still owed, and it is on the open list on the testing page.
- Not a production unit. The sample is a pre-production Purity CHP-12B. Expect the numbers on this page to be re-run on the build we sell.
- Electrical, not acoustic. Nothing here was measured as sound pressure with an artificial ear. We are describing what the cable does to the signal, not a measured frequency response. And the earphone’s own differences from unit to unit are usually larger than anything the cable contributes.
- Ten points, not a sweep. With points this far apart, a narrow resonance sitting between two of them could be missed.
- Above 20 kHz we stop trusting the numbers. The cores were measured lying flat on the bench, the assembled pair was measured wired up in a different geometry, and the high-frequency end was not compensated, so at 40 kHz the parts no longer add up. We show it as a trend in the internal report and leave it out of the charts and the table here.
- A drift we have not explained. Resistance fell with frequency on all four cores by about 6%, which goes the wrong way for how copper behaves and is far larger than the instrument’s stated accuracy. We believe it comes from the test fixture. Until we re-measure with a compensated fixture, we are not going to say anything at all about this cable’s high-frequency resistance.
- The reference earphone has switchable tuning, and we did not record which setting was in use. Its curve is one setting, not the only curve it has.
- The earphone is labelled 16 Ω at 1 kHz; we read 7.7 Ω at 1 kHz. We calculate with what we measured. Lower earphone opposition makes the cable look worse, not better, so this works against us, not for us.
What this means if you are buying a cable
- A cable whose finished resistance lands in this region is not going to change the tone of your earphones. We publish our own measurements and our own method; we are not setting a bar for anybody else’s cable, and we would not judge another company’s numbers measured a different way.
- If you swapped a cable and heard a difference, the difference is real. It just is not coming from the copper. How the cable is routed (over the ear, behind the neck, or hanging down the front), its weight and stiffness, whether it pulls on the earpiece, and how well the connector actually seats can all change what reaches you — the research note on that walks through the four ways a cable reaches your ears.
- The failure you should care about is contact, not resistance. A connector that seats loosely or wears badly adds more resistance than the copper has, and worse, a resistance that moves while you move. That is why we write the plating thickness into the specification and ask you to check fit before judging a cable by ear.
The numbers
Everything on this page comes from one measurement file, taken on 4 November 2026. Both channels of the same cable are shown. “Balance” is stated relative to 1 kHz, so the overall level drop does not appear in it.
The six screen photographs below are the transcription we worked from. If you want the full internal report instead, write to us: [email protected].
| Frequency | Cable's share of the signal (%) | Change in balance vs 1 kHz (dB) | ||
|---|---|---|---|---|
| Left | Right | Left | Right | |
| 10 Hz | 1.55 | 1.58 | +0.137 | +0.131 |
| 50 Hz | 2.16 | 2.16 | +0.097 | +0.093 |
| 100 Hz | 2.77 | 2.75 | +0.045 | +0.043 |
| 500 Hz | 3.35 | 3.31 | −0.017 | −0.017 |
| 1 kHz | 3.14 | 3.11 | 0 | 0 |
| 5 kHz | 3.62 | 3.60 | −0.037 | −0.038 |
| 10 kHz | 5.03 | 5.05 | −0.110 | −0.110 |
| 15 kHz | 6.72 | 6.78 | −0.140 | −0.139 |
| 20 kHz | 8.47 | 8.55 | −0.132 | −0.129 |
The readouts behind the numbers
Every figure on this page was read off an instrument screen by hand, ten frequencies at a time. We keep six of those screens: four cores measured one by one, and the earphone with the cable attached, left and right.
The photographs show the readout area only. The instrument’s body and its on-screen menu labels are cut out, the earphone’s own markings are cut out, and we do not name the instrument — the machine is described by what it resolves, on the testing page.
Open them if you want to check our transcription against our arithmetic. On the four core screens, the row worth looking at is 15 kHz: in the retired round, that point was measured at 15 Hz instead, which is how the old version of the testing page ended up describing a peak that was never there.
Open the six screen readoutsHide the six screen readouts
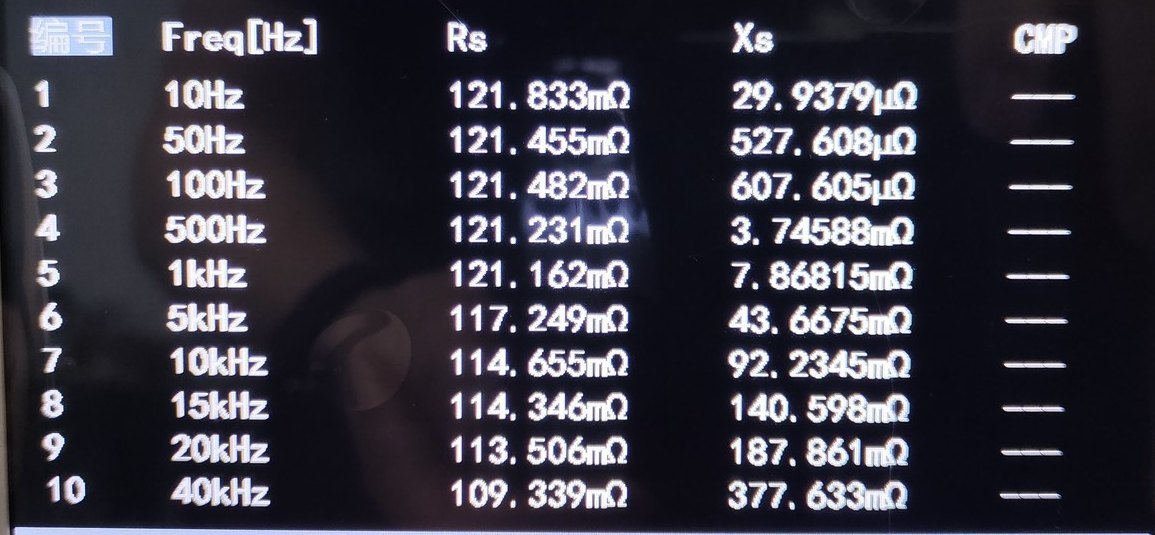
Core L1 — left channel, first core 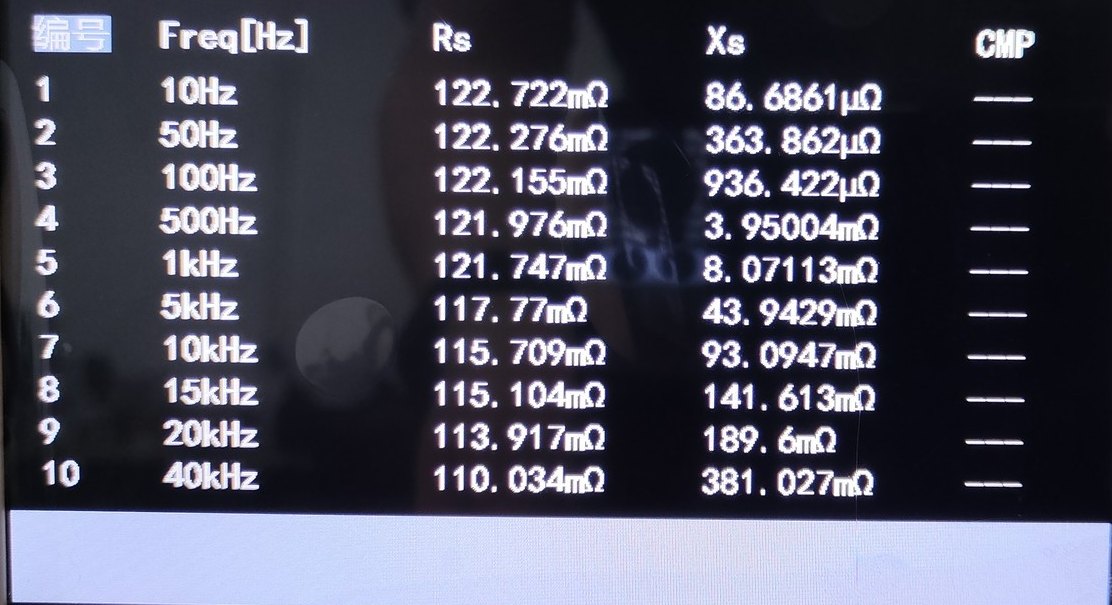
Core L2 — left channel, second core 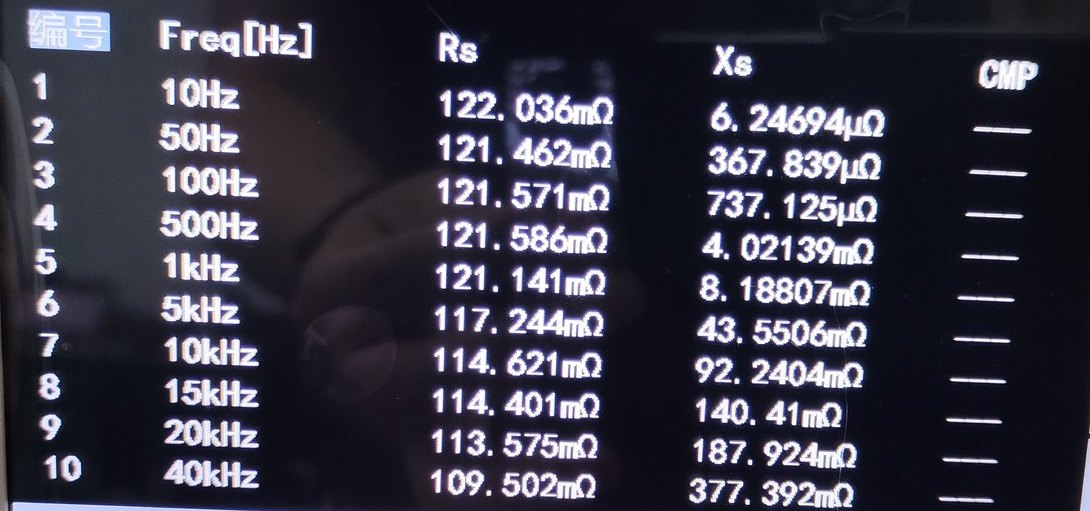
Core R1 — right channel, first core 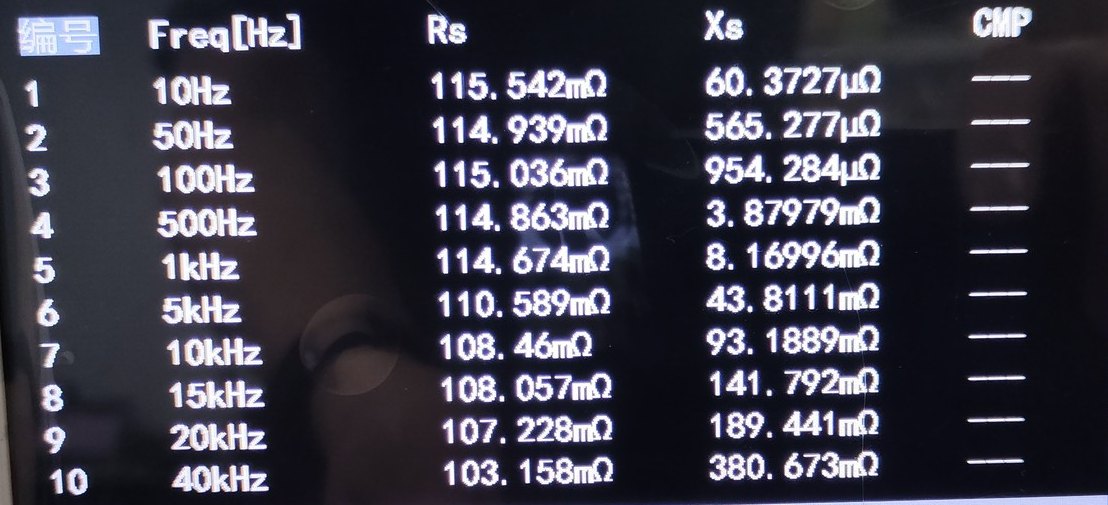
Core R2 — the core that sits lower; this is where the left/right difference starts 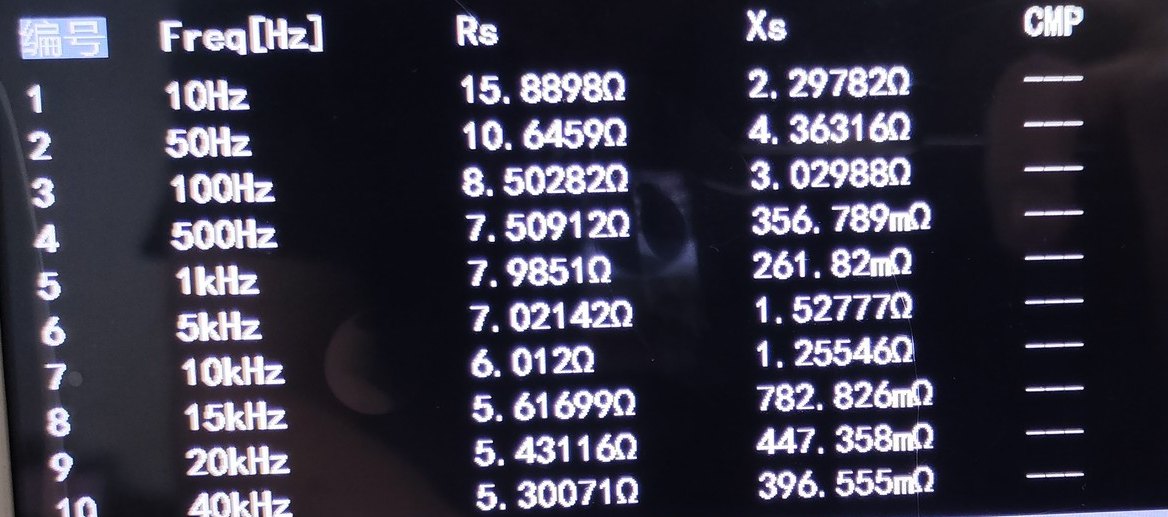
Left ear with the cable in line — values here are in ohms, not milliohms 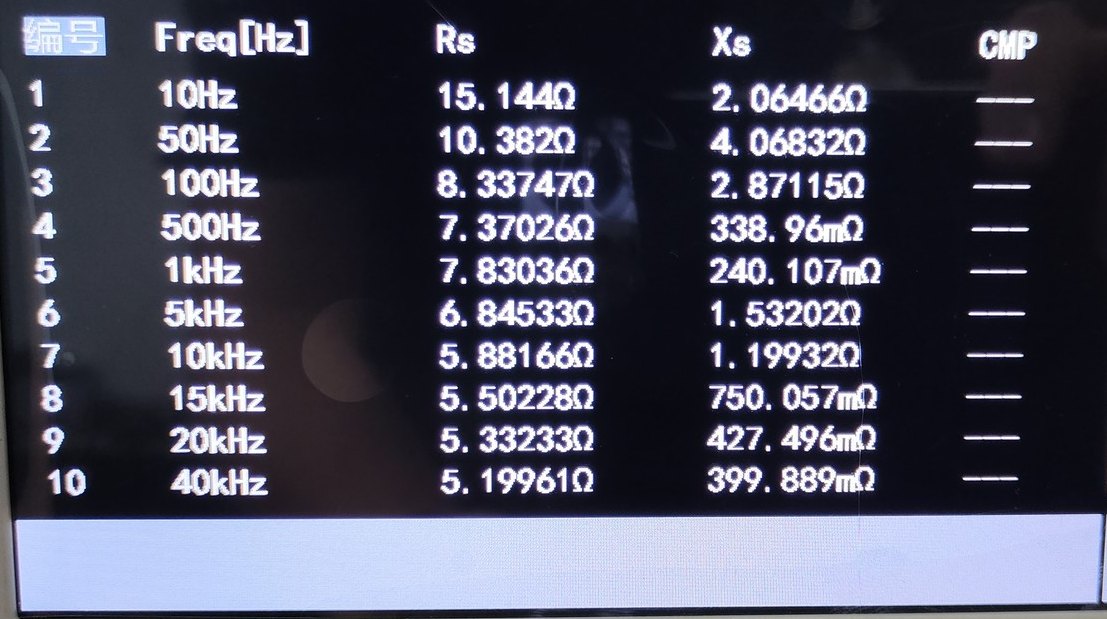
Right ear with the cable in line — values here are in ohms, not milliohms
Read next
- How we measure a cable — the instrument, the method, and the figures we deliberately do not publish.
- What a cable can — and cannot — change about your earphones.